
Global Debt Hits A New Record High Of $217 Trillion; 327% Of GDP
Global Debt Hits Record $237 Trillion, Up $21TN In 2017
Last June we reported that according to the Institute of International Finance - perhaps best known for its periodic and concerning reports summarizing global leverage statistics - as of the end of 2016, in a period of so-called "coordinated growth", global debt hit a new all time high of $217 trillion, over 327% of global GDP, and up $50 trillion over the past decade.

Six months later, on January 4, 2018, the IIF released another global debt analysis, which disclosed that global debt rose to a record $233 trillion at the end of Q3 of 2017 between $63Tn in government, $58Tn in financial, $68TN in non-financial and $44Tn in household sectors, a total increase of $16 trillion increase in just 9 months.
Now, according to its latest quarterly update, the IIF has calculated that global debt rose another $4 trillion in the past quarter, to a record $237 trillion in the fourth quarter of 2017, and more than $70 trillion higher from a decade earlier, and up roughly $20 trillion in 2017 alone.

The IIF report, which also sources data from the IMF and BIS, found that the share of global debt remains well above 300% of global GDP, with mature market, i.e., DM, debt/GDP now at 382%. The silver lining: that number was slightly below recent levels, as increasing GDP growth in DMs helped reduce the debt-to-GDP ratio. However, this was more than offset by a surge in debt in emerging markets, where total debt/GDP is now well above 200%.
The good news, if only temporarily, is that on a consolidated basis, global debt/GDP fell for the fifth consecutive quarter as global growth accelerated: the ratio is now around 317.8%, or 4% points below the all time high hit in Q43 2016. To be sure, even a modest slowdown in GDP growth, let alone a contraction, will promptly send the ratio surging to new all time highs.
So what was the culprit for this unprecedented debt surge? Central banks of course.
“Still-low global rates continue to support unprecedented levels of debt accumulation,” officials from the IIF said in a release.
As the report also notes, among mature markets, household debt as a percentage of GDP hit all-time highs in Belgium, Canada, France, Luxembourg, Norway, Sweden and Switzerland, which - as Bloomberg correctly notes - That’s a worrying signal, with interest rates beginning to rise globally. Ireland and Italy are the only major countries where household debt as a percentage of GDP is below 50 percent.
IIF representatives also highlighted the weaker U.S. dollar as having “masked longer-term concerns about debt sustainability, particularly in emerging markets.” The reduction in debt to GDP came mainly from developed markets, such as the United States and Western Europe, but was an overall trend with 36 of the 49 countries in the survey’s sample recording a drop in debt-to-GDP.
Among emerging markets, household debt to GDP is approaching parity in South Korea at 94.6 percent.
Finally, the report also found that U.S. government debt is now 99% of GDP as a sector. With the United States expected to record a $1 trillion budget deficit by 2020, according to the latest just released CBO forecast, the US should cross 100% debt/GDP in the next few months...

Not surprisingly, China continues to be the biggest source of global debt growth, with the country's total debt load now surpassing 300%.

While much of the debt issuance at the financial sector level has moderated in recent years, supplanted by outside money created by central banks, debt in the non-financial sector has continued to grow, and as of Q1 2017, hit an all time high of 242% of GDP.

An interesting observation by the IIF: despite the recent dollar strength (if not so much in the past quarter), dollar bond issuance in Emerging Markets has been on a tear over the past year.

Another notable observation: while the EM bond universe has increased by $2.5 trillion to $18.4 trillion since 2016, only 25% of this debt is tradeable

What is more troubling, however, is the IIF's observation that despite the relentless foreign portfolio inflows into EM, the credit quality of many emerging markets has deteriored
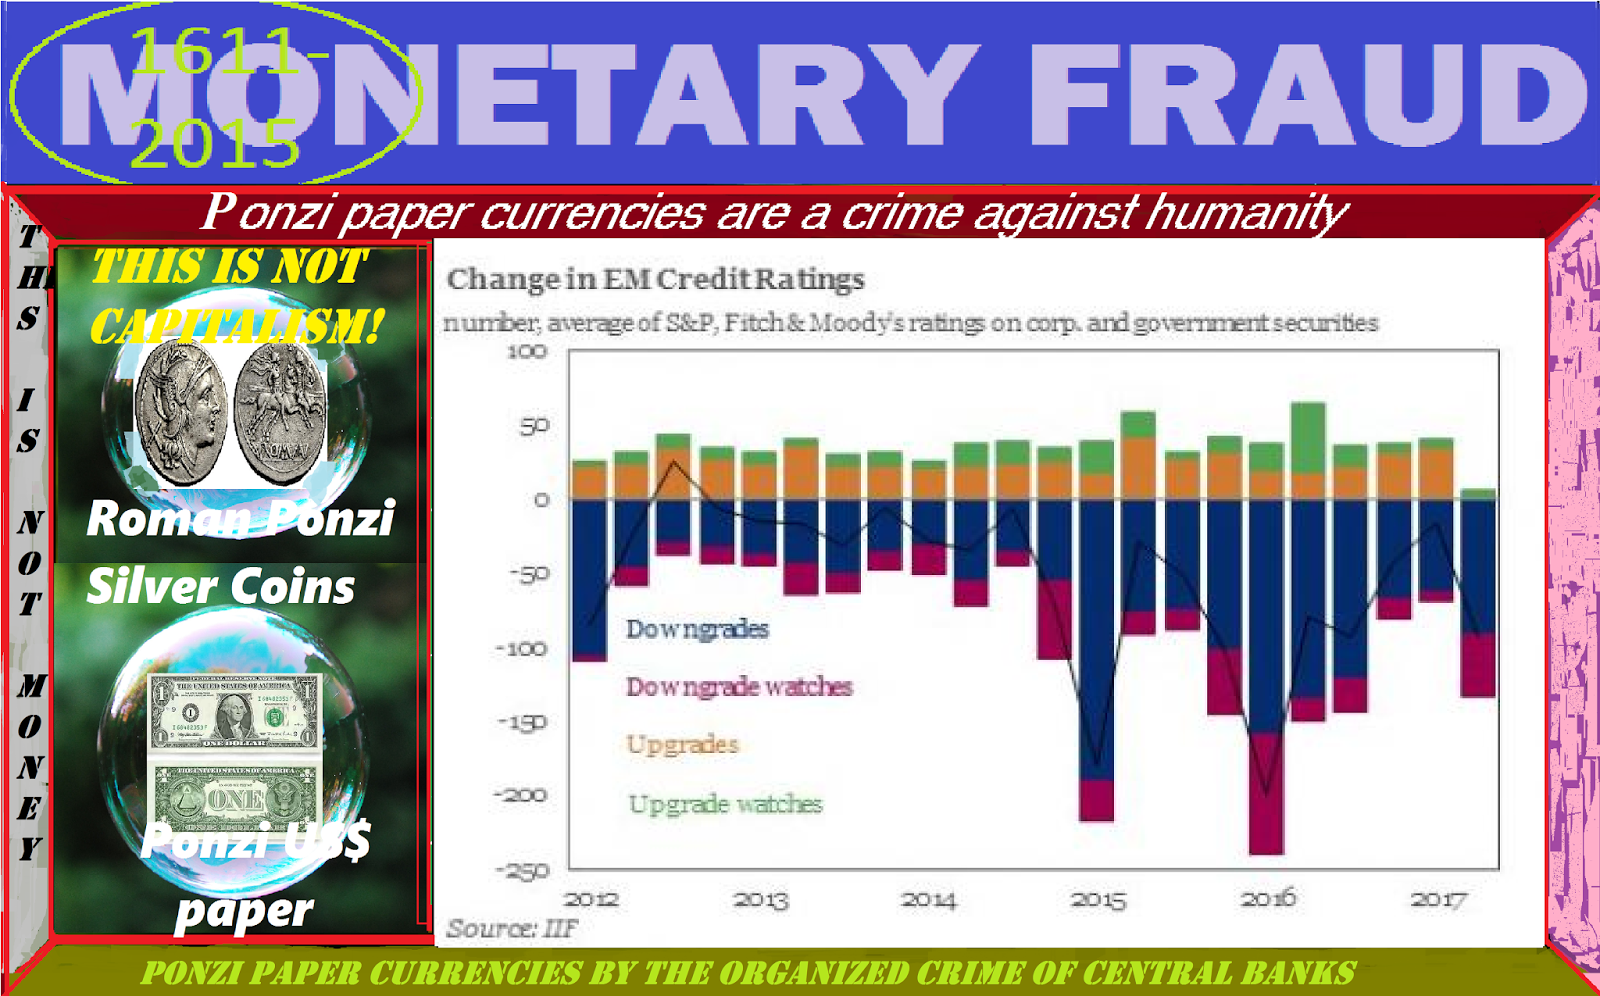
This is an especially acute problem because there is over $1.9 trillion in EM bonds and loans coming due by the end of 2018. Should the EM sector fall can not

Finally, here is perhaps the most troubling chart of all: for all those wondering how oil-exporters in the Gulf region have funded their budgets, and maintained their economies from sliding into recession or social disorder, the answer is shown below: a dramatic increase in new debt issuance.

So what is the policymakers' response as global debt hits new all time highs? To raise interest rates.
Get the most out of what The Crypto School has to offer. Learn About All 3 of our Products!
Get the most out of what The Crypto School has to offer. Learn About All 3 of our Products!
No comments:
Post a Comment